


How an Inventory Control Chart Can Free Up Cash Flow

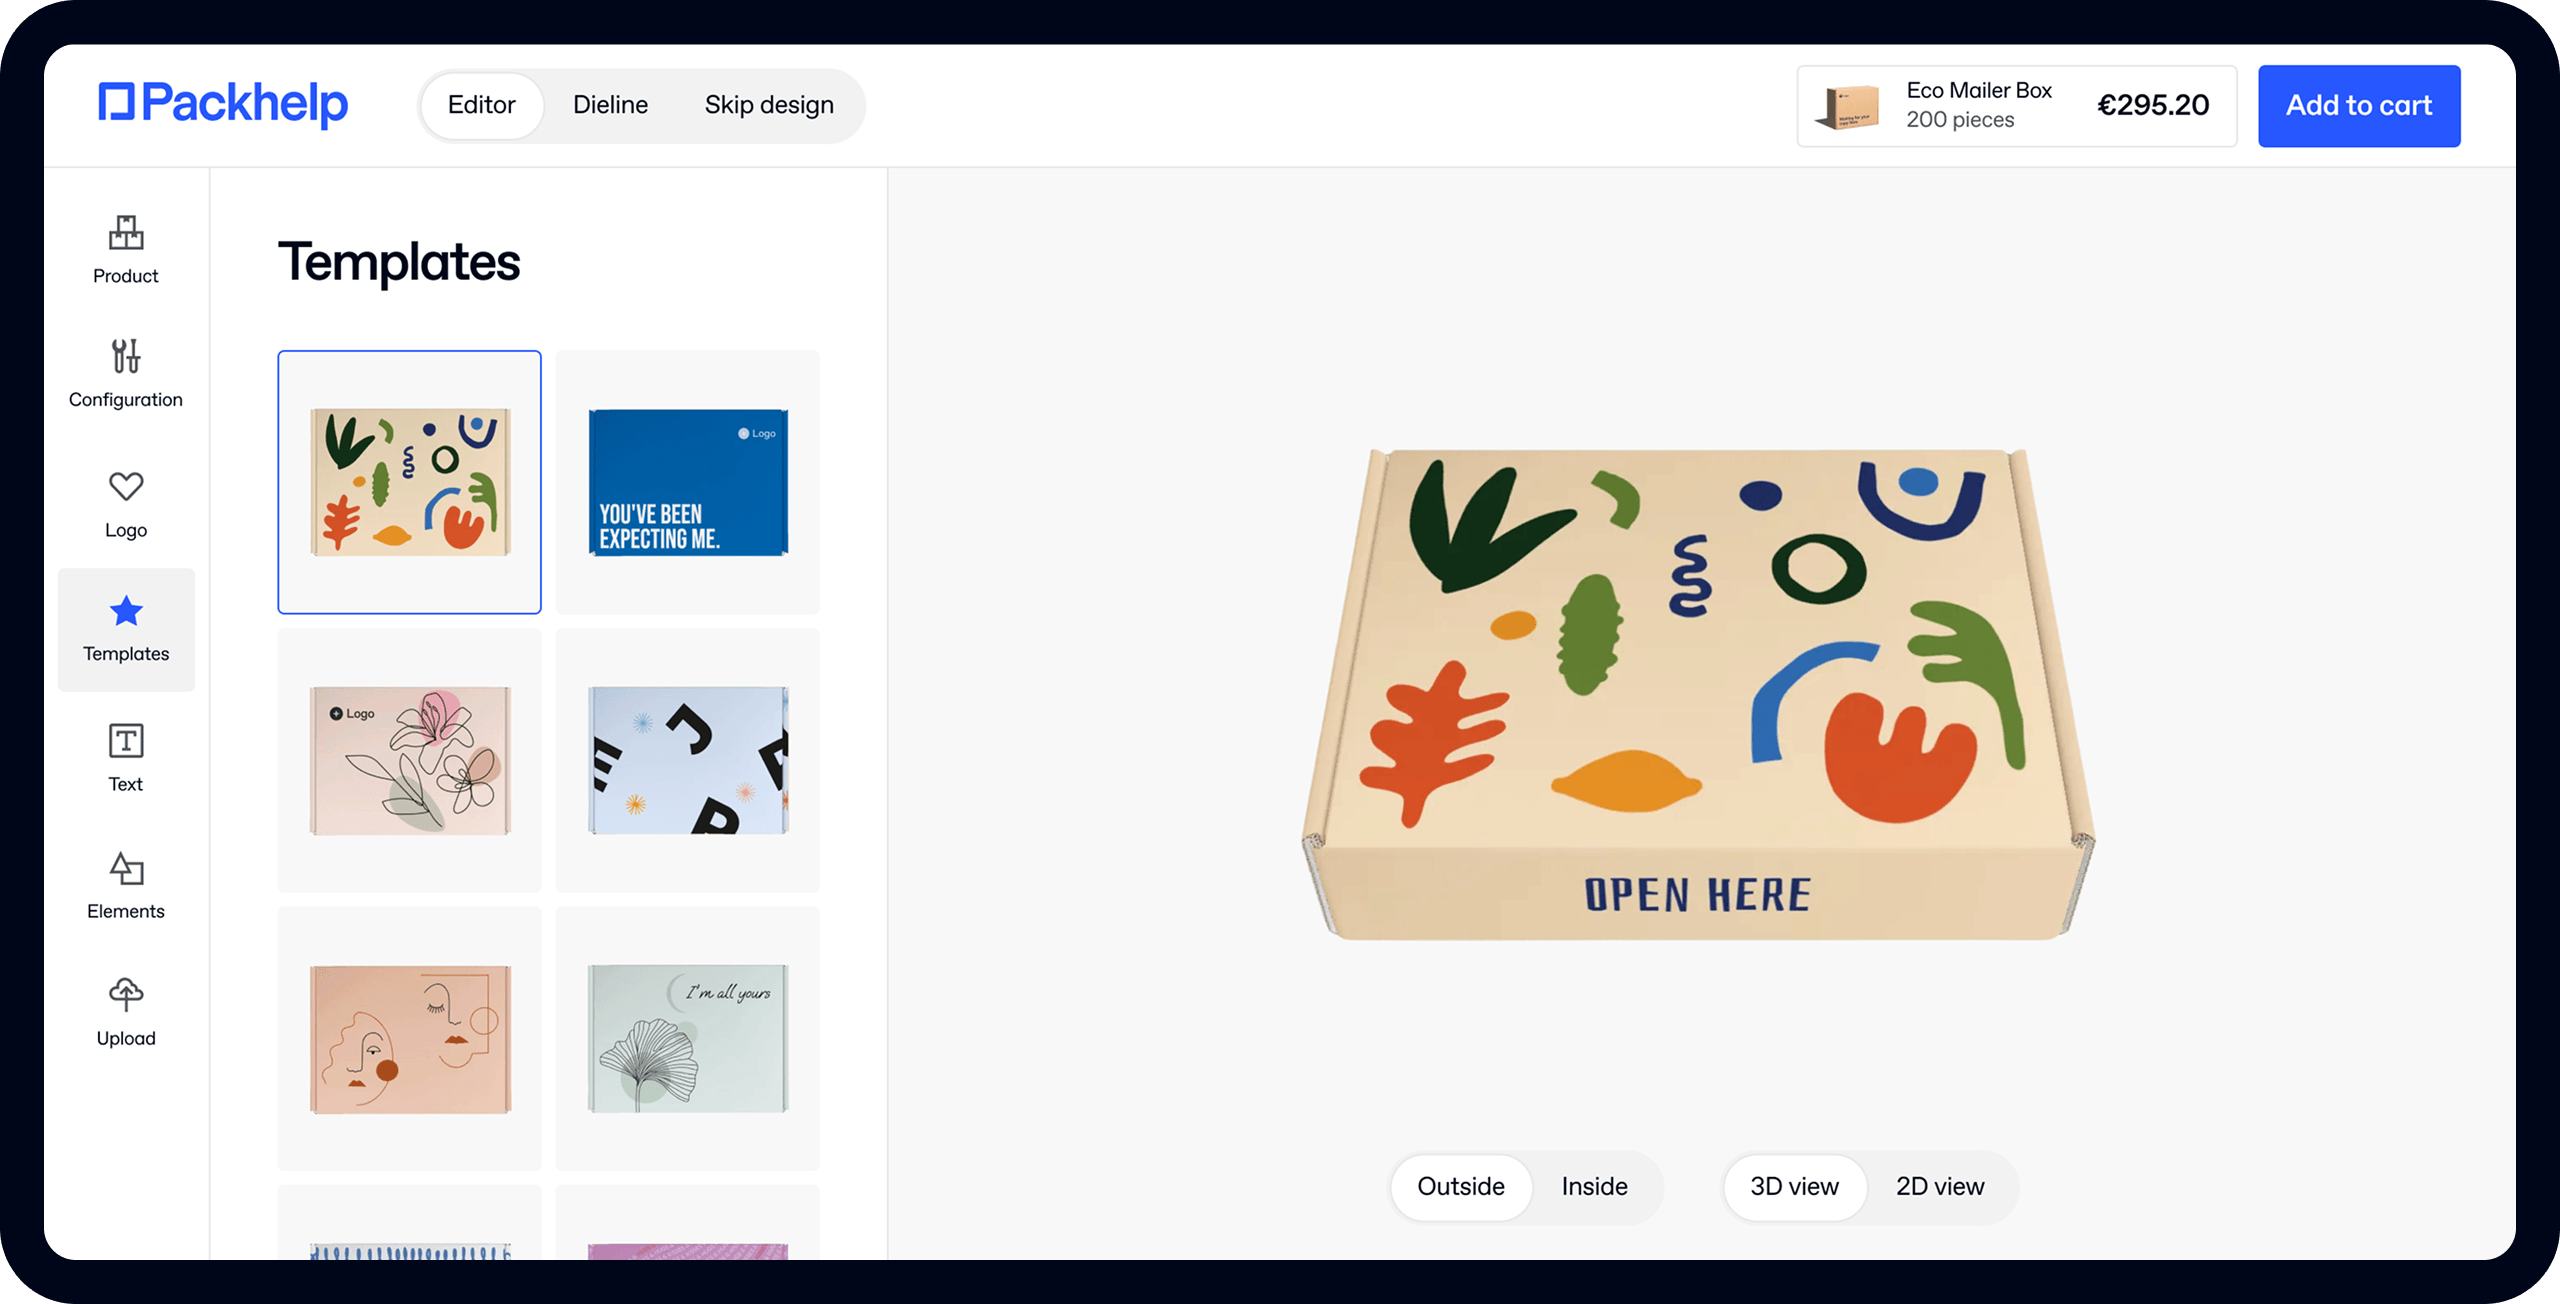
- 200+ templates & patterns
- Real time 3D packaging preview
- Upload logo and choose brand colours

Subscribe now! Receive 15% discount.
Don’t miss out – get 15% off your first order when you join the newsletter. It’s fast, free, and kinda smart.

You're now subscribed!
In this article:
Your inventory is a significant asset to your company.
It goes toward the company's net worth and is vital in a good fulfilment process.
Managing it correctly is simply essential to many facets of your business.
Limiting the amount of waste and keeping the right amount of inventory on shelves is crucial to keeping your inventory healthy. For example, packaging is a supply for which many ecommerce brands create an inventory control chart.
At what point should we order more packaging?
How many units can we store on our shelves?

The answer to these questions depends on your packaging supplier and many other elements of your business.
An inventory control chart, sometimes called a stock control chart, can help you find a balance between lead times, maximum levels, buffer stock and much more.
What is an inventory control chart?
An inventory control chart is a visual chart that depicts the inputs and outputs of your inventory over time concerning minimum and maximum stock levels.
With this chart made, you're able to calculate and visually associate things like:
- Order quantity - The number of units you buy each time you place an order.
- Re-order level - The trigger at which you place a new order to replenish your stocks.
- Lead times - The time between placing an order and that order being on your shelves, ready to use.
- Buffer stocks - The number of units you have in reserve should your inventory not be replenished in time.
- Minimum stock level - The minimum number of units your business wants to have in stock at any given time
- Maximum stock level - The maximum number of units you'd like to have in stock or the maximum number of units you have space to store.
An inventory control chart helps you manage a multichannel inventory, while also maximising cash flow.
Here's an example of an inventory control chart:

Key takeaways
In the image above, we can see:
- Maximum stock levels are
- Minimum stock levels are
- Reorder quantity is
- Each month X units are used
- Reorder is placed when stock levels get to X units
- Lead times are approximated
But what happens when your supplier says lead times are extended?
The image below shows how properties change when a supplier's lead times are extended from 4 weeks to 6 weeks.

As a result of longer lead times, the threshold at which you place a new order is increased - in this case, from 600 to 800.
The image below shows what happens when demand increases and stock is used much quicker.
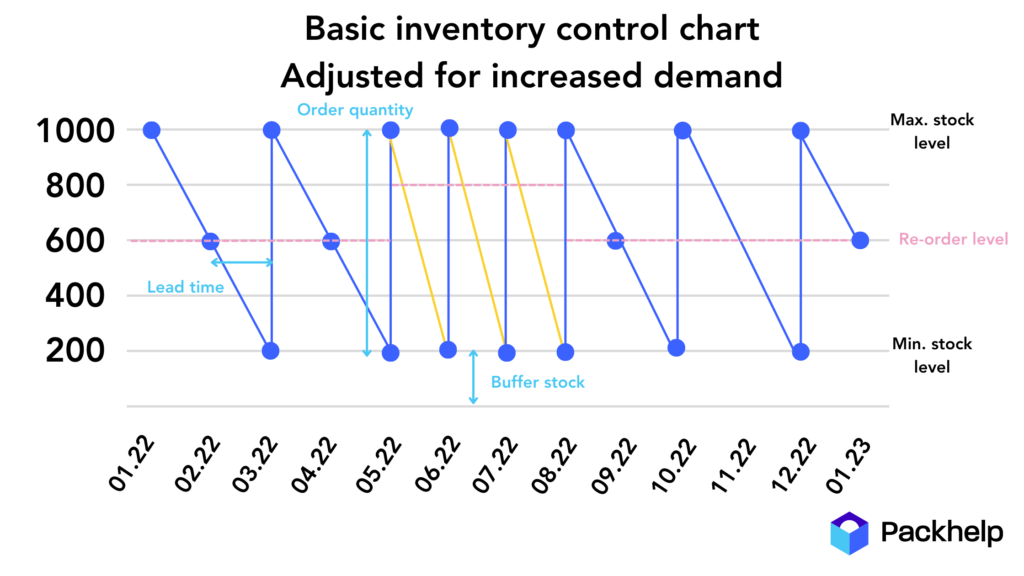
We can see that again that the reorder level increases.
It's important to note that with longer lead times or increased demand (or a combination of the two), your buffer stock becomes more important.
If lead times are a little longer or stock runs out a little quicker, your buffer stock will be relied upon heavily.
When can you use an inventory control chart?
You can use an inventory control chart to understand your inventory cycles better and free up cash flow. You can use it to fine-tune your inventory control methods, adjust the buffer stock level, adapt to longer lead times and change reorder quantities.
If you keep too much inventory on the shelves, your cash flow will be stifled. Not enough stock on the shelves, and you won't have the supplies needed to fulfil orders.

Simply put, an inventory control chart helps you find the balance between too much stock and not enough and stay at that point in order to maximise cash flow.
How do you calculate a stock control chart?
Many factors influence the creation of your stock control chart. For example, how much cash can you have sitting on shelves as buffer stock? Your cash flow and liquidity of your products impact this immensely.
Low stock level advantages
Lower overheads. By keeping stock levels lower, there's less space required to store that product, meaning no added requirements for more space.
Liquidity. Lower stock levels mean that if a product goes obsolete, you have fewer units to sell or dispose of.
Capital-friendly. Keeping lower stock numbers means there's less capital sitting on your shelves, freeing up cash to be spent elsewhere in the business.
Lean. Operating a lean business is a model that has a wide range of benefits, and holding fewer units of products on shelves complements this business model.
High stock level advantages
Fewer delays. In keeping high stock levels, that product is less likely to create delays further down the supply chain.
Fewer stockouts. Running out of stock is detrimental to a business in many ways. Always keeping high stock levels minimises the likelihood of running out of stock.
Proactive response to increased demand. If demand for a product suddenly spikes, having a high stock volume means you can better cater to that demand.
Bulk savings. Many suppliers offer discounts for buying in bulk. Keeping high stock levels allows you to take advantage of these price points only available for high-volume orders.
Factors affecting reorder levels
Here are several other things to consider when calculating a stock control chart:
Supplier lead times. This is generally a non-negotiable period, but it may also vary depending on your supplier, their supply chain and their ability to keep up with the demand for their own products. Generally, the longer the lead time, the higher the reorder level, as you saw in the example earlier.
Stock out implications. What happens when you run out of stock? Do you have the ability to take backorders? Are your customers comfortable ordering a product you don't have in stock?
Demand fluctuates for many types of products. Seasonal demand, trends, marketing and advertising and economic factors influence your product's demand. Demand forecasting can help in establishing reorder levels for your products.
Conclusion
An inventory control chart can help you run your business more efficiently. It's a visual way to fine-tune your warehouse's operations, with the overall goal of freeing up cash while also having enough stock to keep up with unexpected demand.
Packaging is one of those supplies for which many businesses create a stock control chart. If you're looking for a packaging supplier to help you meet the demand of your growing business, reach out to Packhelp.
Our packaging specialists can help you find the ideal reorder level for your business and can help you lock in long-term, competitive pricing, no matter what that level may be.


